
One of the most widely accepted multiple comparison procedures is Tukey's HSD, which stands for "honestly significant difference". While it sounds a bit like a passive-aggressive smear campaign against other procedures, this is the procedure that we will be using, but for the record, the Neuman-Keuls comparison is equally well-accepted.
In order to maintain a single type I error rate for the comparisons, a number of simple rules must be followed. First, only conduct multiple comparisons after getting a significant result from your ANOVA. Sounds like an obvious point, but I have seen cases where people have skipped the ANOVA and gone straight to the multiple comparisons. Don't be that guy! The ever-present possibility of a type I error means that it is possible to get a "significant result" from multiple comparisons when no significant difference exists among the groups.
Second, you must organize your comparisons such that the test is performed on the largest difference first, and subsequent tests only performed if there is a significant result. In other words, you will assume that if you do not get a significant result for one comparison, all comparisons with a smaller difference between the means will not be significant either. Again, the reasoning should seem pretty straightforward, but there are warning labels cautioning you not to take hairdryers into the shower for a reason...
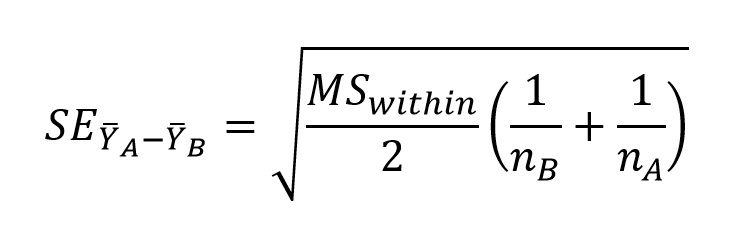
The test statistic employed by Tukey's HSD is q, which is calculated for a comparison between means A and B as:
Your life will be a little easier if you choose A and B such that the difference between their means is positive. As per usual, the numerator is pretty straightforward, but we need to do a little extra work to calculate the SE for the denominator. This is still relatively straightforward, and is calculated as:
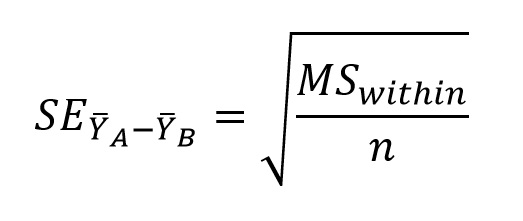
You can obtain the value for MSwithin from your ANOVA table (remember that your textbook refers to this value as MSerror). The above calculation allows for different sample sizes, in which case the analysis is technically referred to as the Tukey-Kramer procedure. When sample sizes are equal, the equation above simplifies to:
Choose one of the data sets for which you obtained a significant result, and perform the Tukey comparisons, comparing qs to the critical values in Table B.5 in your textbook (the table for α = 0.05 starts on page 723 in the 5th edition) for the appropriate number of groups (remember that your text uses k instead of a), and using the degrees of freedom for MSwithin (i.e., dfwithin) as v. Remember to start with the largest difference between means, work your way through the next largest difference, and stop comparing when you get a non-significant result.
Feel free to choose the nonparametric result for the sculpins if you like...while I have no supporting evidence, it seems that if the ANOVA works on the ranks, then Tukey's should work on the ranks as well. If I'm wrong, we'll just have to modify the "honestly" part of the name. I would strongly recommend, however, that if you are analyzing data for publication or presentation, and you have done a nonparametric ANOVA, that you apply a nonparametric multiple comparison, as described in Section 11.5 of your textbook. If you are feeling really ambitious, you can apply Tukey's HSD to the ranks for the sculpin data, and also the nonparametric multiple comparisons, and see if the results differ...
We can display the results of a multiple comparisons test on a graph by using Tukey letters. This is a simple matter of adding letters to the bars (you will have to insert a text box in Excel to do so) such that means that do not differ share a letter. In some cases this is a simple procedure, while in others it creates overlapping groups. Consider the figure below:
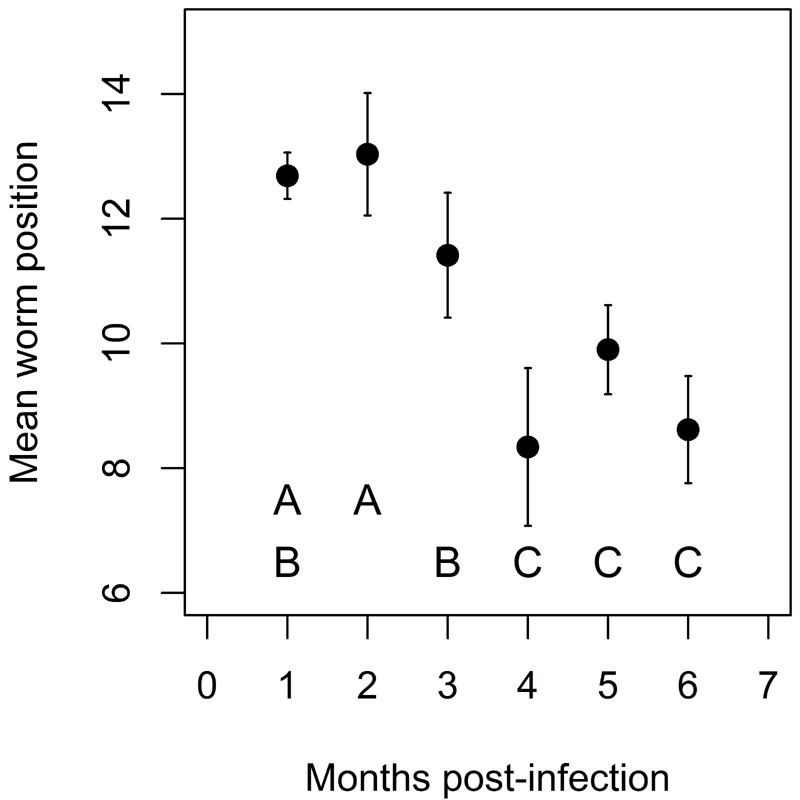
These data represent the change in the mean position of trematodes (Echinostoma caproni) in a mouse intestine over 6 months of infection. While the last 3 months group well from the first 3, we see overlapping groups in the first 3 months, based on the Tukey letters.
Here is the part that you are going to love...you are going to graph the dataset for which you did the multiple comparisons showing the means with standard error bars (use the actual means and error bars, and not the ranked values if you are presenting the sculpin data), and apply Tukey letters to the graph. Do not be fooled by the fact that the means on the preceding graph are presented as points. Your graphs should be presented as a bar graph. Make sure to review the graphing procedure if you do not remember all of the necessary formatting changes, and please paste the graph into your Word document so that I can hang it on my fridge.
As always, save your Word document with the answers, and your Excel workbook as "yourlastnameex8", and submit them both via Blackboard.
Disclaimer: Once again, no squirrels, newts, or sculpins were harmed, inconvenienced, or even observed in the production of these data sets. While the means and estimates of the error are based on real scientific pursuits, the data were generated by models (the R programs can be viewed HERE) in order to protect the innocent.
Send comments, suggestions, and corrections to: Derek Zelmer