In general, people tend to focus on the central tendency of a distribution, viewing variance merely as a step in generating an error term for the mean. In some cases, however, the variance will be the parameter of interest (it certainly was for Darwin), and so it is useful to know how to calculate confidence intervals for estimates of population variance.
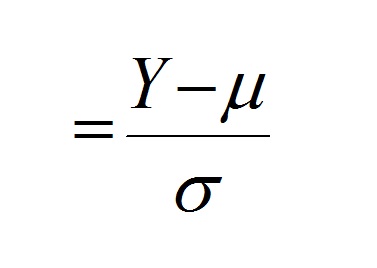
Let us consider again the formula for calculating a standardized deviate:
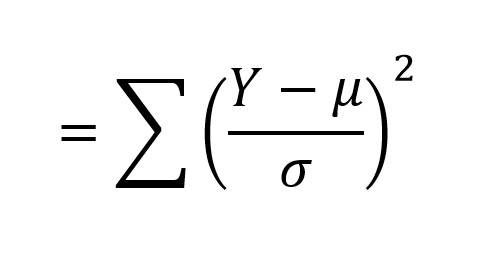
If we draw samples from a normal distribution, with a sample size of n, convert these observations to standardized normal deviates using the above formula, square the standardized normal deviates, and take their sum:
The distribution of these sums forms a probability distribution that should be familiar to you (at least by name): the χ2-distribution (Chi-square). Like the t-distribution, the shape of the χ2- distribution varies with the degrees of freedom (n - 1 in our example, where n is the number of observations making up the sample), as can be seen in the following graphs:
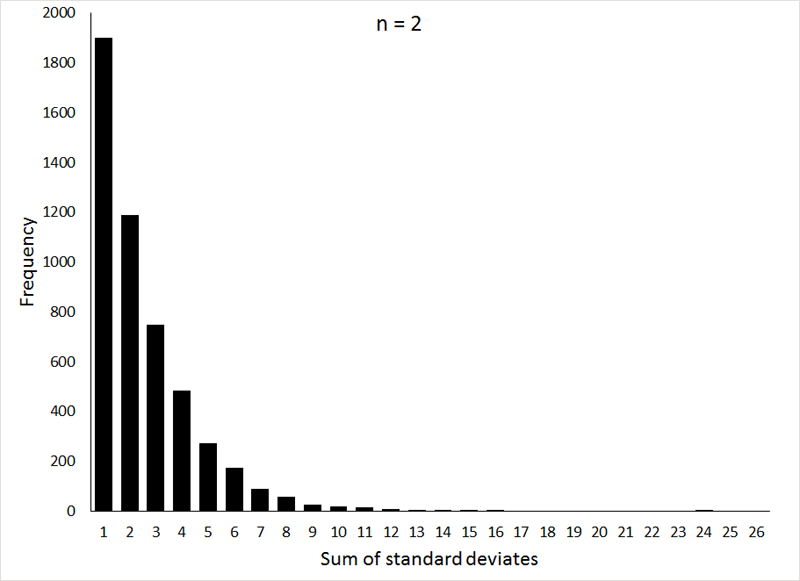
If the animation does not work, or if you would like to see the individual graphs, they can be viewed HERE.
These graphs were generated (the R program can be viewed HERE) by taking 5000 samples, with sample sizes of 2, 4, and 6 (corresponding to 1, 3, and 5 degrees of freedom, respectively), from a normal distribution with μ = 0 and σ = 1, and squaring the sum of the observations.
Question 5: Look again at the formula for a standardized deviate, and explain why values drawn from a normal population where μ = 0 and σ = 1 can be considered as standardized normal deviates.
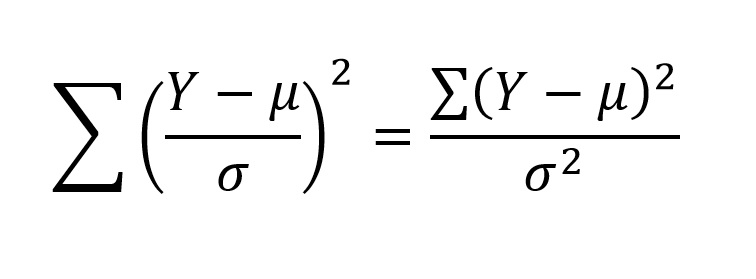
We can rewrite the formula for the variable shown in the distribution as:
And apply it to sample data as shown below:
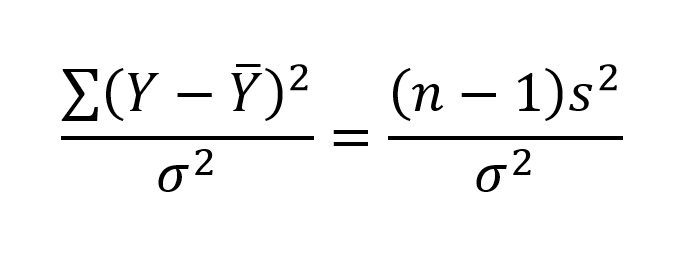
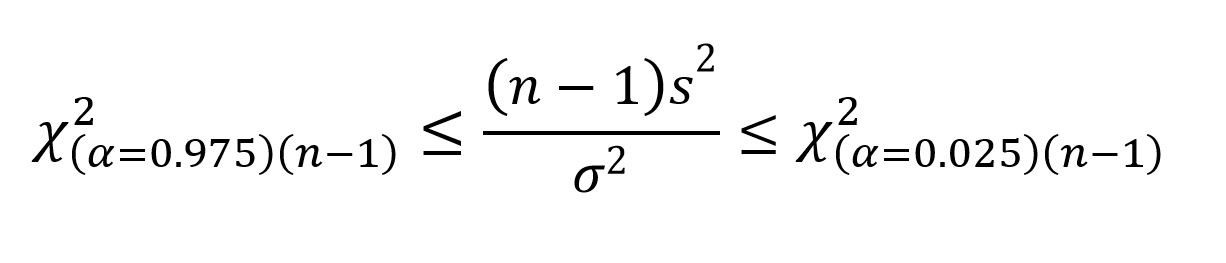
Note that the symbol for variance in the denominator has not changed. This still is population variance. Knowing that these values follow a χ2-distribution means that we can determine the boundaries within which 95% of the values will occur. Because the χ2-distribution is not symmetrical, we need to calculate the upper and lower confidence intervals separately. Table B.1 in your appendix (starting on page 672 in the 5th edition) shows the critical values for the χ2-distribution. As with the t-distribution table, the left column contains the values for degrees of freedom (v), and there is a row of probabilities across the top. Again, the asymmetry of the distribution means that we will consider each tail separately.
Given that we are interested in 95% confidence intervals (α=0.05), the probabilities that we need are 0.975 = 1-(α/2), which defines the left boundary (97.5% of the values exceed this value), and 0.025 = α/2, which defines the right boundary. The reason we are using α/2 is because the 0.05 probability is divided between the two tails. Thus, we can define the 95% limits for (n - 1)s2/σ2 as:
Where the χ2 values are taken from the table. We can express this in terms of population variance (σ2) as:
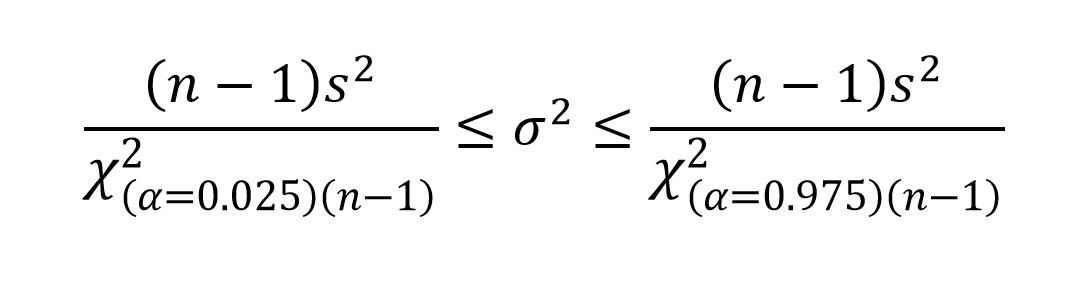
Remembering that sample variance (s2) is the sum of squares (∑y2) divided by (n - 1), we can simplify (n - 1)s2 as ∑y2:
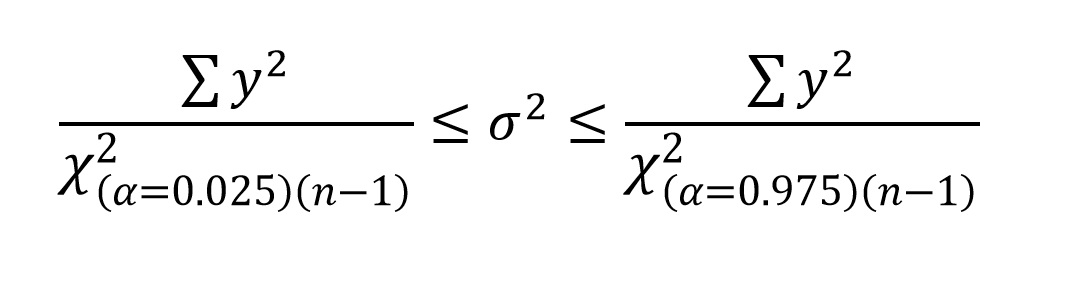
Provided that you remember that ∑y2 is our notation for the sum of squares (sum of the squared deviates), you should have no trouble calculating the 95% confidence intervals for an estimate of population variance (remember that sample variance is our estimate of population variance) using the above formula. Please note that the value of α, and the degrees of freedom (n-1) are provided in the denominator as a subscript of χ2. They are not part of the calculation, they simply tell you where to find the χ2 value on the table. Because the confidence intervals are not symmetrical, they need to be reported in the same fashion shown in the formula, i.e., LCI ≤ σ2 ≤ UCI.
Question 6: Calculate the sample variance, and the associated 95% confidence intervals for the variances for all 4 samples in your Excel workbook. Also, calculate the 99% confidence intervals for the variance for the BAP data.
All too often, people will estimate a proportion (p = x/n) from each of a series of samples, and then average these proportions across samples to produce a "mean proportion", and report s or SE of that mean as an estimate of the error in that proportion. This is wrong, for many reasons; of which we will address two. The first is that those measures of dispersion indicate the precision of the estimates (how similar they are to one another), and not the accuracy (how close they are to the actual value) of the estimates. Second, it should be obvious that the proportion p = 0.75 estimated from a sample of 10000 is more likely to be accurate than the same proportion estimated from a sample of 4. Averaging estimated proportions across samples does not, in any way, take into account the sample sizes used to generate those estimates.
The solution is to pool the samples together into a single sample, calculate the estimate of the proportion from that, and calculate 95% confidence intervals based on that sample. If you are interested in exploring this recommendation, or those that follow, in a little more depth, you can download THIS paper.
There are a number of options for calculating 95% confidence intervals for proportions, but I recommend using Wilson-score intervals, or Clopper-Pearson intervals (although the latter might be a little too conservative). Unfortunately, the calculation of either is cumbersome. Thus, I will provide you with a gift. You can download THIS spreadsheet, which does the calculations for you. For a proportion p = x/n, you can input the values of x and n, and both the Clopper-Pearson and Wilson score intervals will be calculated for you. Each interval is calculated as both the actual proportion, and as the width, which is the number you would add (UCI) or subtract (LCI) from your proportion, p, to get the actual value. The latter is of great use when presenting the 95% confidence intervals as error bars on a bar graph.
You are welcome.
As always, save your Word document and Excel spreadsheet as yourlastnameex5 and submit it to me via Blackboard.
Week 5 Objectives
Understand what constitutes a normal distribution
Understand how confidence intervals for a sample mean are derived from a distribution of sample means
Understand what the t-distribution represents
Understand what the "critical values" presented in statistical tables represent, and how to identify them using degrees of freedom and alpha
Know how to generate confidence intervals from critical values
Send comments, suggestions, and corrections to: Derek Zelmer