Adding error bars is not too difficult, but does take a few more steps in Excel than it probably should. Worse still, if you make a mistake, Excel will add the wrong error bars. Make sure to check that the values on the graph match those that you calculated when you have completed all of the steps. Speaking of checking up, when was the last time you saved your workbook?
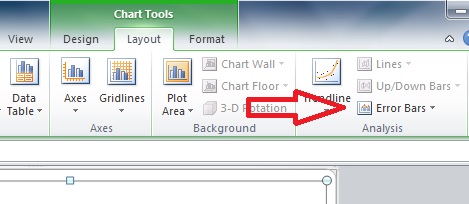
The first step is to click on the graph to bring up the sickly green "Chart Tools" tabs, and click on the "Layout" tab. Off to the right, you will see the "Error Bars" label (red arrow below):
Click on "Error Bars" to bring up the menu pictured below, and click on "More Error Bars Options...":

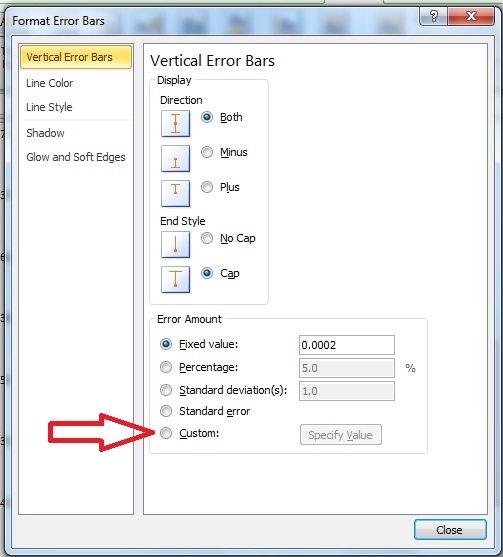
This will bring up the menu shown below. Click on the circle next to "Custom" (indicated by the red arrow), and then click on the adjacent "Specify Value" button.
This will bring up a selection box that should look somewhat familiar:
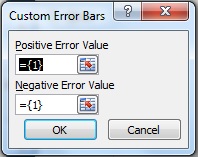
In the same way you selected the values for your graph, select the 2 standard errors from the table you made for both the positive and negative error values, as the error is the same magnitude in both directions (remember, this is just a visual depiction of "mean∓SE"). You will have to click on the tab at the bottom to go to the worksheet where your data are. Click "OK", and you should have the correct error bars in your graph after you close the menu.
Your graph for the fish data should look like this:
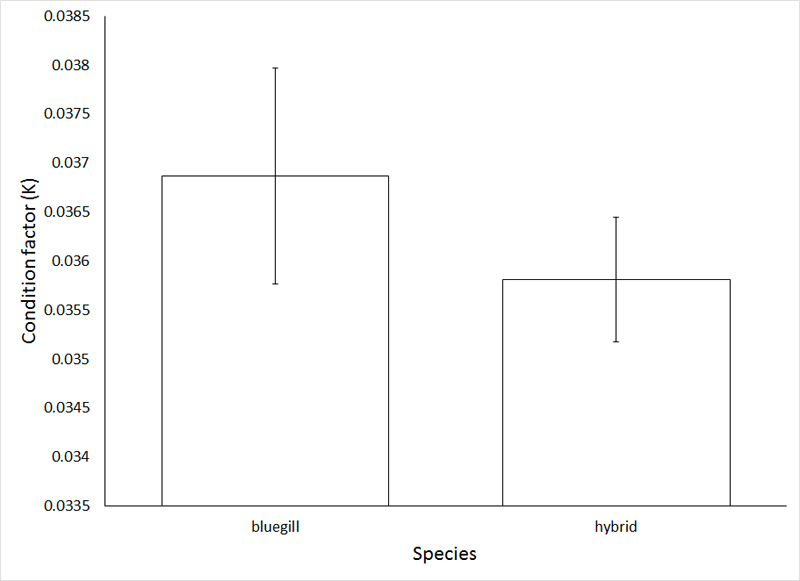
As a rule of thumb (which we no longer will need once we learn some proper analytical techniques), if the standard error bars overlap, the means do not differ. Apply this rule of thumb to answer:
Question 5: Examine the graphs for both sets of data (birds and fish), and conclude whether or not the means differ in each case.
As always, save your Word document and Excel workbook as "yourlastnameex3", and submit via Blackboard.
Week 3 Objectives
Understand the concept of central tendency, and know the measures used to describe it
Understand the concept of dispersion, and know the measures used to describe it
Understand why the "sum of squares" is a useful measure of variation, and know how to calculate it
Understand why standard deviation (s) and standard error (SE) meaure different things, and know when to report one vs the other
Understand how to add error bars to bar graphs in Excel
Send comments, suggestions, and corrections to: Derek Zelmer